Candlesticks
Green vs Red Candles
Understand what bullish and bearish candles show, how candle color is formed, and why context matters more than color alone.
Updated 2026-06-15
Candle color is a quick way to see whether price closed above or below where it opened. It is useful, but it is not enough by itself.
A green candle usually means price closed above the open. A red candle usually means price closed below the open.
What a green candle means
A green candle means the close is higher than the open for that candle period.
This often shows buyers made progress during the period, but it does not automatically mean the market is strong. A small green candle after a large drop may only show a pause. A green candle into major resistance may show buying pressure, but also possible exhaustion.
What a red candle means
A red candle means the close is lower than the open for that candle period.
This often shows sellers made progress during the period. Like green candles, red candles need context. A red candle into support may show selling pressure, but the next candles decide whether that pressure continues.
Color is only the first clue
The same candle color can mean different things in different places.
A large green candle closing near its high after a pullback may show buyers taking control again. A small green candle with a long upper wick after a strong rally may show buyers tried to continue but were sold into. Both are green. They tell different stories.
A large red candle closing near its low can show sellers controlled the whole period. A red candle with a long lower wick at support can show sellers pushed down and failed to keep price there. Both are red. The close, wick, range, and location decide the read.
Read candle color with context
- Compare the body size with nearby candles.
- Check whether the candle closed near its high or low.
- Look for wicks that show rejection.
- Read the candle inside the current trend or range.
- Notice whether price is near support or resistance.
Common beginner mistake
The mistake is thinking green means buy and red means sell. Candle color describes what happened during one period. It does not predict the next period.
Better practice is to ask:
- Who made progress during this candle?
- Was that progress strong or weak?
- Did price close in a meaningful location?
- Is this candle part of a larger move?
What to notice in the app screenshot
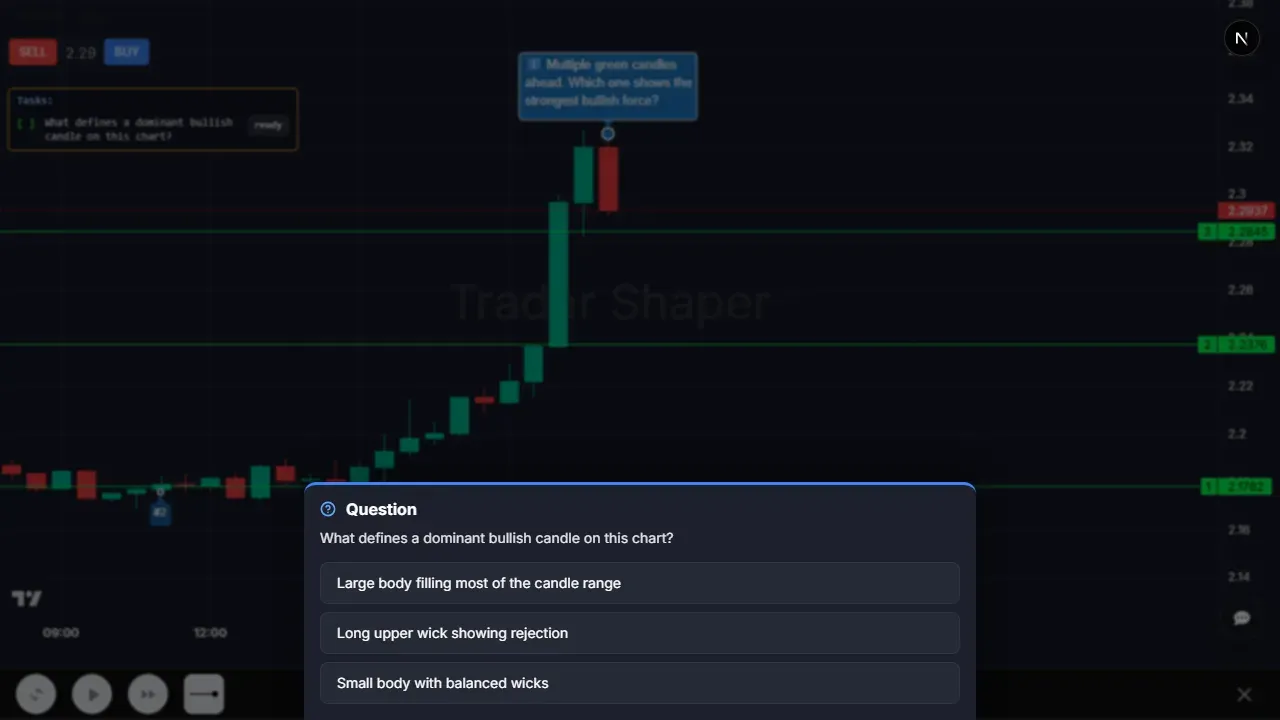
This screenshot fits the page because the question is not just “is the candle green?” It asks what defines a dominant bullish candle. The correct visual idea is a large body that fills most of the candle range. That means buyers did not merely close above the open; they controlled most of the period.
Practice examples
Example 1: green but weak. Price rallies into an area that rejected it twice before. The candle closes green, but it leaves a long upper wick and finishes near the middle of its range. The color says buyers made progress from open to close. The wick says sellers answered strongly before the period ended. The better read is not simply bullish; it is contested buying at resistance.
Example 2: red but rejected. Price falls into a support zone and prints a red candle with a long lower wick. The close is still below the open, so the candle is red, but the lower prices did not hold. The useful information is that sellers reached lower and were pushed back. The next candle will matter more than the color label.
Example 3: color inside a trend. In a clean uptrend, several red candles can simply be a pullback if the swing structure remains intact. In a downtrend, several green candles can be a bounce inside the larger decline. Color tells you the period outcome; structure tells you the larger story.
One useful drill is to cover the candle colors and read only body position, wicks, and close location. Then reveal the colors and see whether they changed the read. If the color changes your answer more than the candle structure does, the shortcut is still too strong.
How color can mislead in real practice
Color is visually loud, so it often wins attention before structure does. That is useful for scanning, but dangerous for judgment. A beginner may see a green candle after a drop and assume buyers are back. A trained reader asks whether the candle closed strongly, whether it broke any meaningful swing, and whether it formed at a level where buyers had reason to appear.
The same problem happens with red candles. A red candle in an uptrend can be a normal pullback, especially if it stays above the last higher low. Calling it bearish because of color alone ignores the larger structure. In practice, many good trends contain plenty of candles in the opposite color.
A better habit is to say the color last. First say body size, wick behavior, and close location. Then add color as one detail: “large body, close near high, green” or “red candle, but long lower wick at support.” This order keeps the read based on what the candle did, not on the shortcut your eyes noticed first.
When you review mistakes, look for color-driven language. If your note says only “green candle” or “red candle,” it is incomplete. Rewrite it using control, rejection, and location.
Exercise: describe without color
Open a chart and choose five candles. For each one, describe the candle without saying green, red, bullish, or bearish. Use only anatomy: large body, small body, close near high, close near low, upper wick, lower wick, full range, and location.
After writing the descriptions, reveal the colors and ask whether the color added anything important. Sometimes it will. A large body closing near the high and colored green is a clean buyer-control candle. Sometimes it will not. A red candle with a long lower wick at support may carry buyer-rejection information despite its color.
This drill weakens the automatic “green good, red bad” shortcut. It trains you to read what price actually did during the candle period.
Test yourself
Use these to check whether you are reading color or reading the candle.
1. A green candle closes far below its high at a resistance zone. What is the problem with calling it bullish?
Show answer
The color only says the close was above the open. The long upper wick at resistance shows buyers were rejected before the close. It may still be part of a bullish move, but the candle itself is much weaker than the color suggests.
2. A red candle at support has a long lower wick and closes near its open. What happened during that period?
Show answer
Sellers pushed price lower, but buyers absorbed the move and pushed it back up before the close. The candle is red, but the failed move down is the important information.
3. Why is 'green means buy, red means sell' a bad practice rule?
Show answer
Because color describes the relationship between open and close for one period. It says nothing by itself about location, structure, wick rejection, or whether the next candle confirms the move.