Market Structure
Support and Resistance
Learn how support and resistance describe areas where price has reacted before, and how to practice identifying them on real charts.
Updated 2026-06-15
Support and resistance are areas where price has reacted before. They help traders organize a chart, but they are not exact prediction lines.
Support is an area where price has previously found buying interest or stopped falling. Resistance is an area where price has previously found selling interest or stopped rising.
Support
Support is usually below current price. It can form after price falls into an area and buyers respond strongly enough to stop or reverse the move.
Support does not guarantee price will bounce again. It simply marks an area worth paying attention to because the market has reacted there before.
Resistance
Resistance is usually above current price. It can form after price rises into an area and sellers respond strongly enough to stop or reverse the move.
Like support, resistance is better treated as a zone than a single perfect price.
Why zones are better than perfect lines
Real price action is noisy. Different traders use different timeframes, order types, and risk levels. For that reason, price often reacts around an area instead of touching one exact line.
If you draw exact lines, you will reject good reads because price missed the line by a few ticks. If you draw zones, you can focus on the behavior that matters: did price enter the area, react, and leave with force? The zone is just a container for that behavior.
Signs an area may matter
- Price reacted from the area more than once.
- The reaction created a clear move away from the area.
- The area lines up with obvious swing highs or swing lows.
- The level is visible without forcing the chart to fit your idea.
Practice goal
When practicing support and resistance, start by marking the most obvious areas only. Too many lines make the chart harder to read.
Ask:
- Where did price clearly turn before?
- Did the turn create a meaningful move?
- Is the area still relevant on the current timeframe?
- Am I marking the chart because price reacted, or because I want a trade?
What to notice in the app screenshot
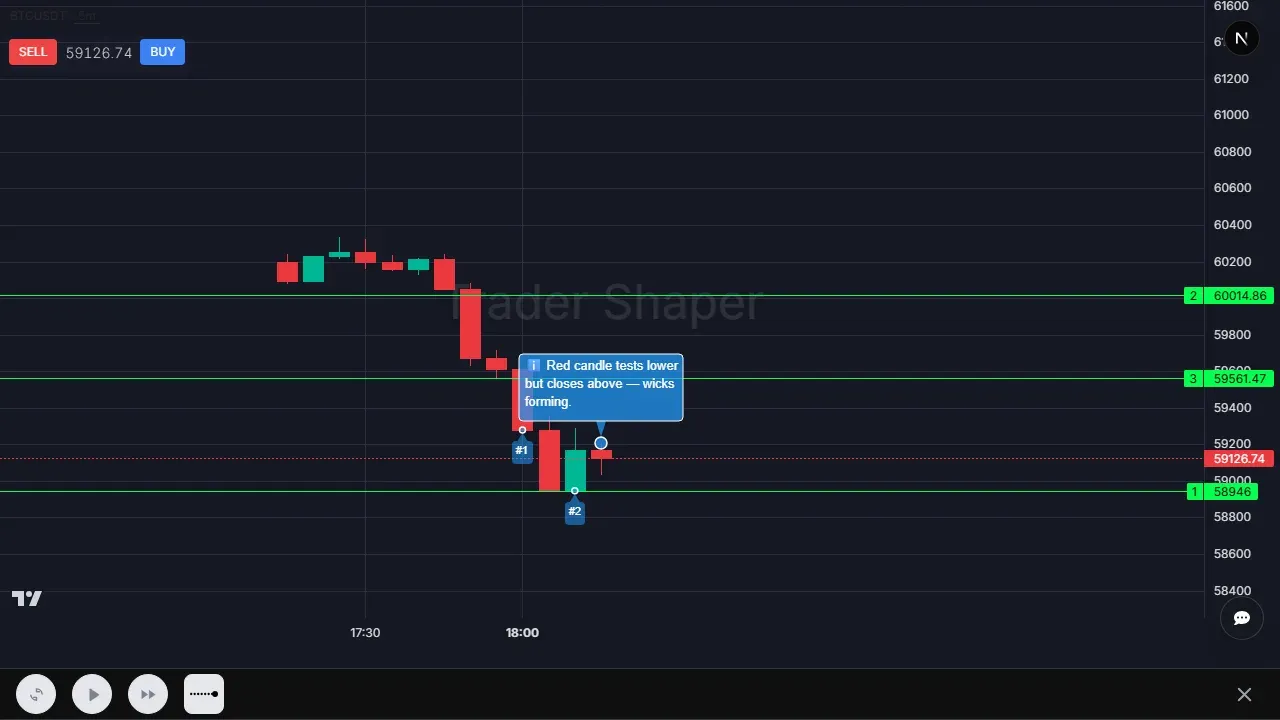
This screenshot belongs on a support and resistance page because the important information is the horizontal reaction area. Price tests lower, then closes back above the area. The exact line is less important than the behavior around the zone: approach, test, rejection, and close.
What strong reactions look like
A strong support reaction usually has three parts. Price approaches the area, probes lower or pauses there, then leaves the area with enough force that the turn is obvious at normal zoom. The exact low is less important than the rejection and exit.
A strong resistance reaction is the mirror image. Price approaches from below, fails to hold higher prices, and leaves the area downward. Sometimes that failure is a sharp wick. Sometimes it is several candles that cannot close above the area. Either way, the key is that the market showed a response.
Weak reactions are different. If price drifts through an area slowly, crosses it again and again, or barely moves away after touching it, the level has not proven much. Many beginners count touches. Better practice is to count meaningful reactions.
How support can become resistance
When price breaks below a support zone, the area does not automatically become irrelevant. Traders who bought near support may be trapped. If price later returns to the same zone from below, those traders may sell to exit, while new sellers may treat the old support as resistance.
This is why the same area can matter from both sides. The label changes with price position, but the underlying idea stays the same: the market has shown interest around that area before.
When practicing, review levels after price has had time to react. A good level should make the chart easier to explain after the fact without requiring you to redraw everything. If you keep needing new lines to justify every move, simplify the chart and keep only the areas with the clearest reactions.
How to draw a zone without overfitting
Start with the obvious reaction area, not the exact candle wick. If two swing lows formed near the same price but not perfectly on the same tick, draw a zone that covers the cluster. The market is not measuring your line with a ruler. It is showing where participants previously responded.
Keep the zone narrow enough to be useful. A zone that covers half the chart is not analysis. A practical zone usually includes the bodies and wicks that formed the reaction, while still leaving clear space above and below. If you cannot explain why the zone starts and ends where it does, simplify it.
Then ask what would invalidate the zone. If price slices through the area, closes beyond it, and never reacts, the zone has lost current relevance. If price breaks it and later retests from the other side, the zone may still matter but with a new role. Support can become resistance, and resistance can become support.
This approach keeps support and resistance flexible without making it vague. You are not predicting that a line must hold. You are identifying an area where the market has shown prior interest and then watching the next reaction.
How to review a broken level
A broken level is not automatically a failed analysis. Sometimes the break itself is the useful information. If price breaks through support with a strong close and no immediate recovery, the market has shown that buyers did not defend the area this time. That is a change in behavior.
The next question is whether the area matters from the other side. Old support can become resistance because traders who bought near the level may exit when price retests it from below. Old resistance can become support for the same reason in reverse. The label changes, but the area remains a place where participants may act.
Review broken levels by asking whether price reacted on the retest. If it did, the zone still carried information. If price ignored it from both sides, remove it and simplify the chart.
Test yourself
Check whether you are marking reactions or just drawing lines.
1. Price touches the same area five times but never leaves it with force. Is that strong support or weak evidence?
Show answer
Weak evidence. Touches without reaction show the market is passing through the area, not clearly defending it. A level matters because of the reaction away from it, not because a candle happened to cross it.
2. A level held twice as support, then price broke below it. Why might it still matter later?
Show answer
The same area can act as resistance if price returns from below. Old buyers may exit near breakeven and sellers may press the retest, so the market can still react around the zone.
3. Why should beginners mark zones instead of exact prices?
Show answer
Real reactions cluster around areas. Exact prices create false precision and make valid reactions look wrong when price turns slightly above or below the line.